Monthly Climatic Data/Evapotranspiration Summary
2015 Growing Season
The Central Nebraska Public Power and Irrigation District
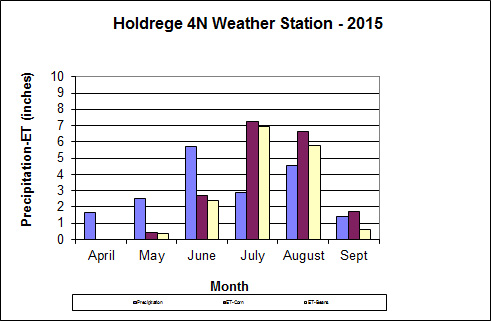
| Holdrege Station (4 miles north) | |||||||||
Month | Avg. High Temp. (F) | Avg. Low Temp. (F) | Avg. Rel. Humidity (%) | Avg. Soil Temp. (F) @ 4 in. | Avg. Wind Speed (mph) | Avg. Solar Langleys | Total Precip. (in.) | Total ET Corn (in.) | Total ET Soybeans (in.) |
| April | 63.8 | 37.8 | 64.4 | 53.9 | 10.9 | 390.6 | 1.67 | 0.00 | 0.00 |
| May | 69.0 | 46.8 | 73.7 | 61.0 | 10.9 | 355.6 | 2.53 | 0.44 | 0.36 |
| June | 82.4 | 58.9 | 74.1 | 73.7 | 8.2 | 409.5 | 5.74 | 2.71 | 2.39 |
| July | 85.0 | 61.9 | 76.1 | 80.7 | 5.9 | 543.9 | 2.87 | 7.25 | 6.96 |
| August | 82.1 | 58.4 | 79.4 | 75.8 | 6.4 | 472.1 | 4.53 | 6.63 | 5.80 |
| September | 82.4 | 57.6 | 70.9 | 71.7 | 7.4 | 362.0 | 1.39 | 1.72 | 0.61 |
| 6 months | 77.46 | 53.57 | 73.12 | 69.48 | 8.28 | 422.30 | 18.73 | 18.75 | 16.12 |
| ET = Evapotranspiration or crop water use | |||||||||
Graphical Representation of ET/Precipitation Data
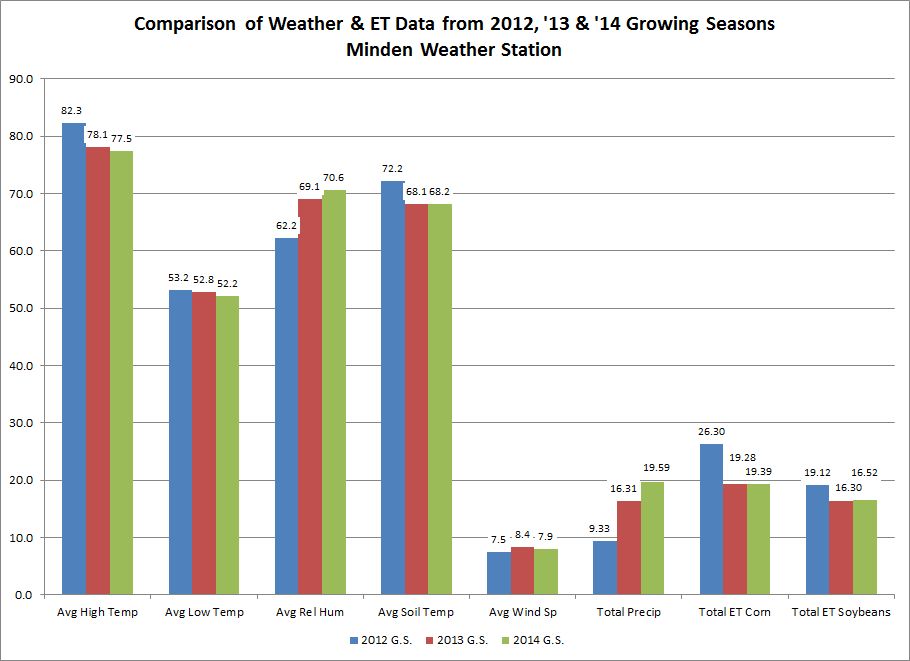
Chart Comparing 2012 through 2014 Weather & ET Data
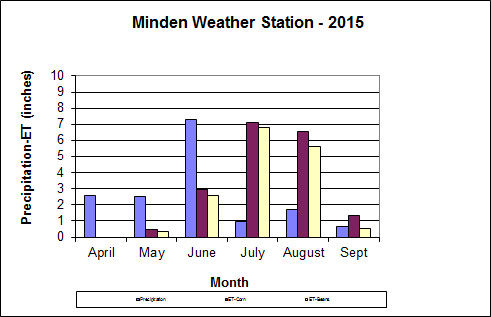
| Minden Station (2 miles north, 4 miles west) | |||||||||
Month | Avg. High Temp. (F) | Avg. Low Temp. (F) | Avg. Rel. Humidity (%) | Avg. Soil Temp. (F) @ 4 in. | Avg. Wind Speed (mph) | Avg. Solar Langleys | Total Precip. (in.) | Total ET Corn (in.) | Total ET Soybeans (in.) |
| April | 64.3 | 37.9 | 65.6 | 53.5 | 10.1 | 385.5 | 2.57 | 0.00 | 0.00 |
| May | 69.5 | 47.4 | 74.5 | 61.2 | 10.4 | 397.2 | 2.53 | 0.46 | 0.36 |
| June | 82.2 | 59.1 | 76.3 | 73.0 | 7.5 | 486.6 | 7.30 | 2.96 | 2.56 |
| July | 85.6 | 61.5 | 78.0 | 80.2 | 5.4 | 546.4 | 0.98 | 7.08 | 6.77 |
| August | 83.3 | 58.3 | 78.1 | 76.6 | 5.5 | 475.5 | 1.72 | 6.56 | 5.63 |
| September | 84.5 | 57.5 | 70.4 | 73.2 | 6.5 | 331.3 | 0.64 | 1.35 | 0.51 |
| 6 months | 78.1 | 53.6 | 73.8 | 69.6 | 7.6 | 437.1 | 15.74 | 18.41 | 15.83 |
| ET = Evapotranspiration or crop water use | |||||||||
Graphical Representation of ET/Precipitation Data
Chart comparing 2012 through 2014 Weather & ET Data
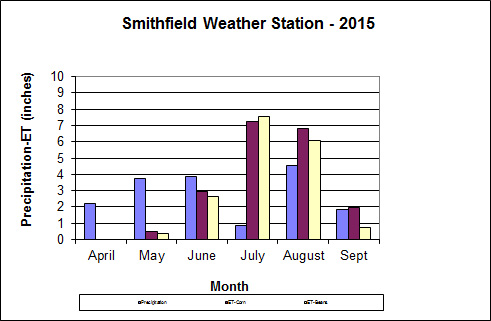
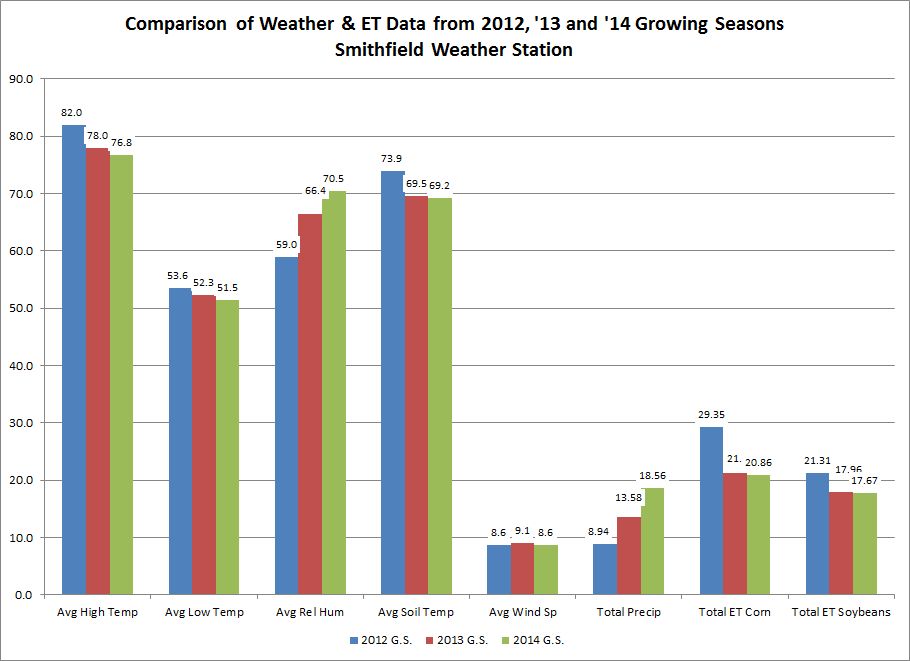
| Smithfield Station (2 miles east) | |||||||||
Month | Avg. High Temp. (F) | Avg. Low Temp. (F) | Avg. Rel. Humidity (%) | Avg. Soil Temp. (F) @ 4 in. | Avg. Wind Speed (mph) | Avg. Solar Langleys | Total Precip. (in.) | Total ET Corn (in.) | Total ET Soybeans (in.) |
| April | 63.9 | 37.4 | 64.8 | 54.7 | 10.6 | 425.3 | 2.99 | 0.00 | 0.00 |
| May | 68.3 | 46.5 | 75.6 | 60.8 | 10.4 | 420.7 | 3.74 | 0.47 | 0.37 |
| June | 82.0 | 58.8 | 74.9 | 74.7 | 7.9 | 516.5 | 3.85 | 2.92 | 2.61 |
| July | 87.3 | 61.3 | 72.9 | 83.2 | 6.2 | 559.6 | 0.84 | 7.25 | 7.58 |
| August | 82.3 | 57.2 | 78.8 | 77.2 | 6.3 | 485.7 | 4.56 | 6.84 | 6.06 |
| September | 82.4 | 56.1 | 71.9 | 73.1 | 7.1 | 382.0 | 1.84 | 1.98 | 0.74 |
| 6 months | 77.72 | 52.90 | 73.17 | 70.64 | 8.10 | 464.96 | 17.82 | 19.46 | 17.36 |
| ET = Evapotranspiration or crop water use | |||||||||
Graphical Representation of ET/Precipitation Data
Chart comparing 2012 through 2014 Weather & ET Data
| Gothenburg Station (1 mile west, 1/2 mile north) | |||||||||
Month | Avg. High Temp. (F) | Avg. Low Temp. (F) | Avg. Rel. Humidity (%) | Avg. Soil Temp. (F) @ 4 in. | Avg. Wind Speed (mph) | Avg. Solar Langleys | Total Precip. (in.) | Total ET Corn (in.) | Total ET Soybeans (in.) |
| April | 63.6 | 38.2 | 62.4 | 53.4 | 10.3 | 411.1 | 3.25 | 0.00 | 0.00 |
| May | 66.9 | 45.7 | 73.5 | 59.5 | 10.2 | 415.9 | 4.28 | 0.47 | 0.35 |
| June | 81.5 | 58.1 | 73.0 | 72.6 | 7.5 | 517.3 | 3.47 | 2.76 | 2.52 |
| July | 86.7 | 61.0 | 69.0 | 78.6 | 6.4 | 532.2 | 3.08 | 7.77 | 7.55 |
| August | 82.6 | 54.5 | 75.7 | 75.4 | 5.9 | 474.9 | 3.49 | 7.06 | 6.40 |
| September | 82.2 | 55.6 | 68.5 | 73.4 | 6.1 | 375.6 | 1.33 | 2.69 | 0.96 |
| 6 months | 77.25 | 52.17 | 70.35 | 68.82 | 7.73 | 454.50 | 18.90 | 20.75 | 17.78 |
| ET = Evapotranspiration or crop water use | |||||||||
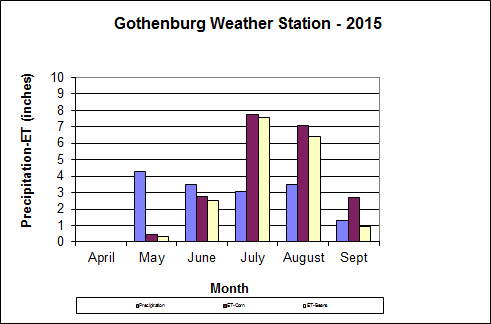
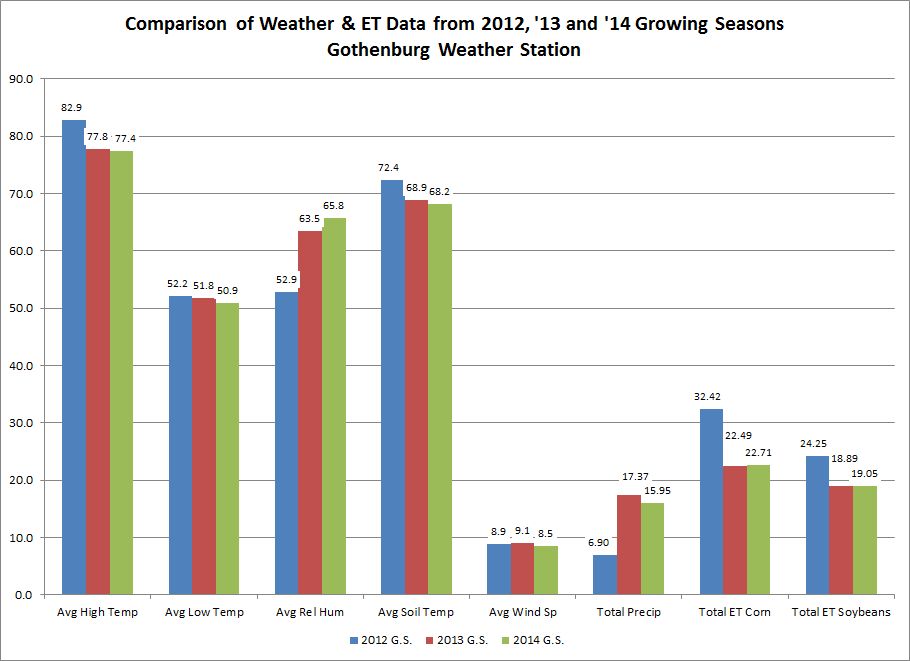
Leave a Reply