| Elevation in Feet Above Mean Sea Level | |||||||
Today June 24 (8 am) |
Week
Ago |
Month
Ago |
Year
Ago |
||||
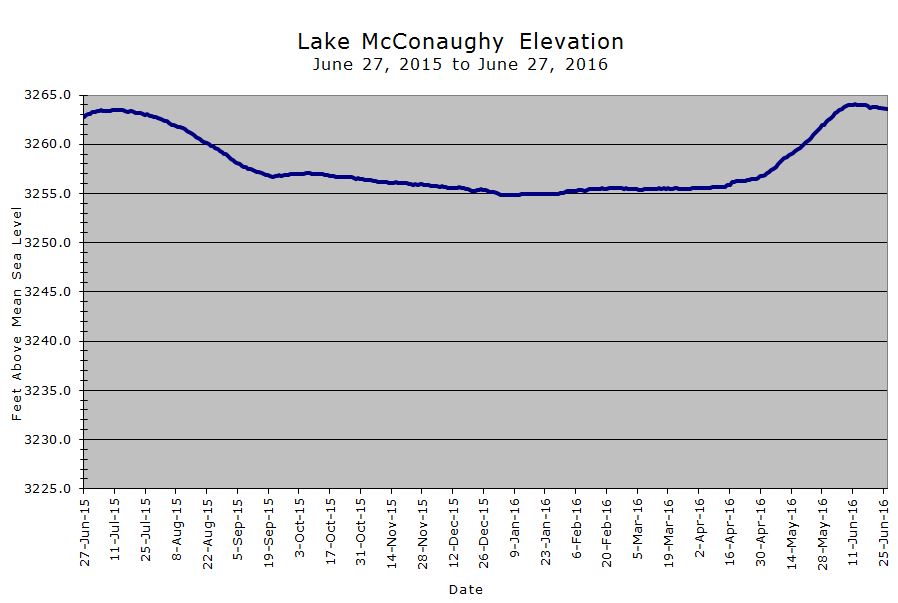
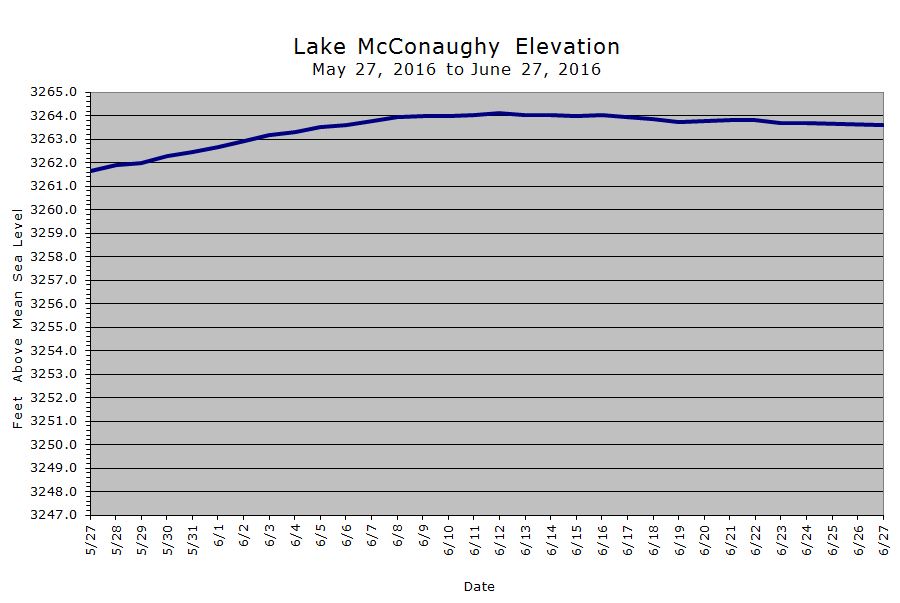
| Lake McConaughy(Historical graph -- Last 12 months graph -- 1-Month graph) | 3263.7 |
3264.0 Vol.= 1,712,500 a-f %Max* = 98.2 |
3260.7 Vol.= 1,614,500 a-f %Max* = 92.6 |
3262.0 Vol.= 1,652,600 a-f %Max* = 94.8 |
|||
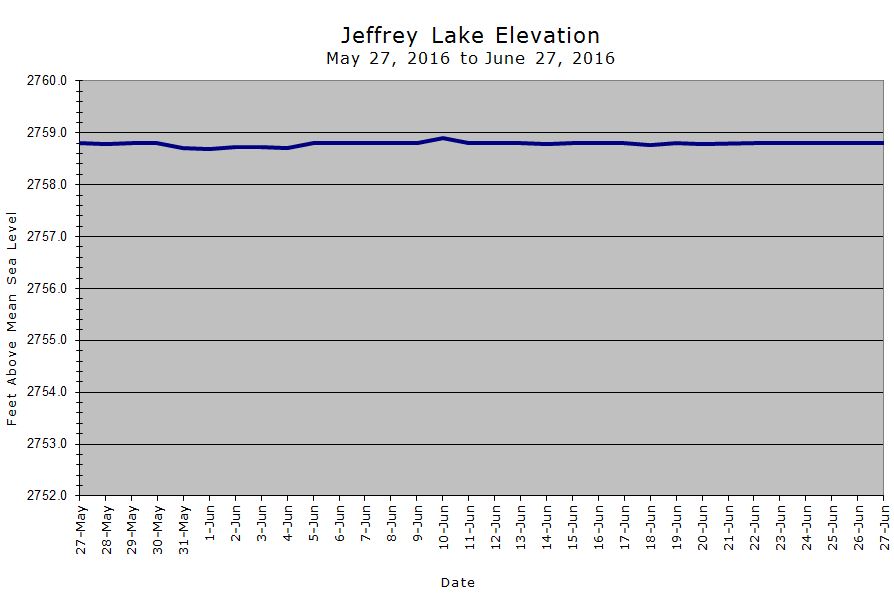
| Jeffrey Lake (30-day graph) | 2758.8 |
2758.8 |
2758.2 |
2757.7 |
|||
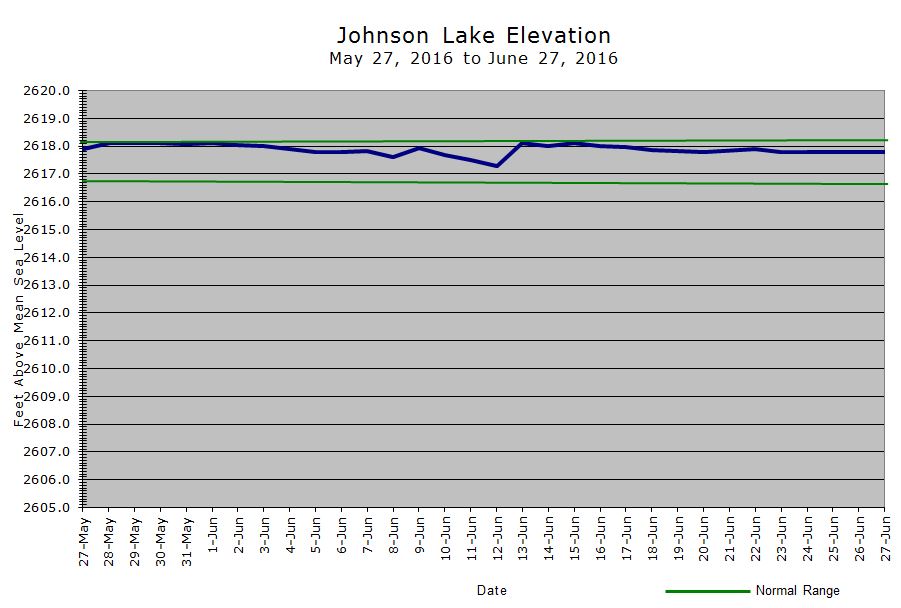
| Johnson Lake (30-day graph) | 2617.8 |
2618.0 |
2617.7 |
2617.9 |
|||
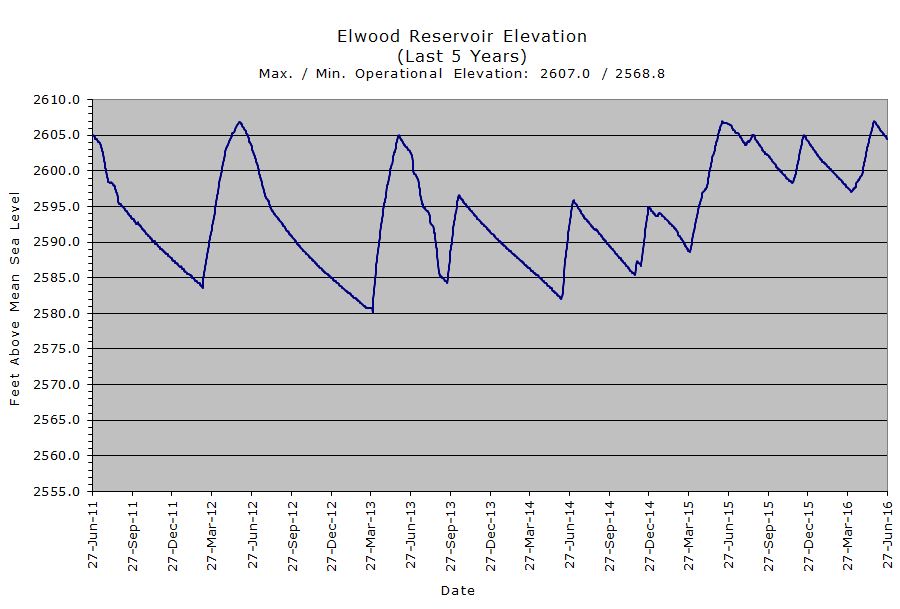
| Elwood Reservoir (Current water year graph -- Last 5 years) (Max. elev. = 2607.0; Min. elev. = 2568.8) | 2604.7 |
2605.3 |
2606.0 |
2606.7 |
|||
| Stream flow in cubic feet per second (cfs). Spot reading for current day; daily average for week, month, and year ago. | |||||||
Today (4 p.m.) |
Week Ago |
Month Ago |
Year Ago |
||||
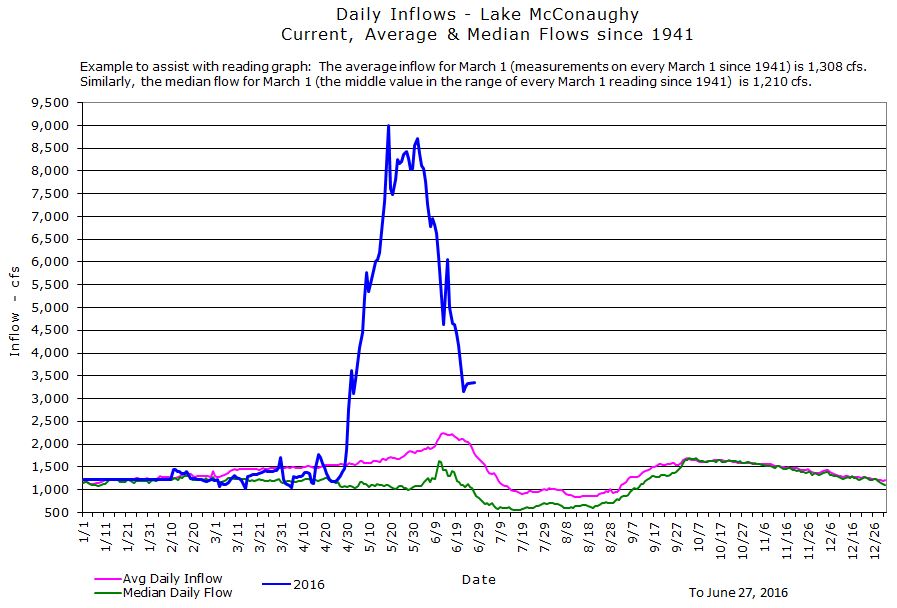
| Inflows to Lake McConaughy (Current, Average & Median Inflow graph) | 3,329 | 4,998 | 8,246 |
5,979 |
|||
| Total Lake McConaughy Outflow | 3,000 |
4,849 |
3,750 | 1,280 | |||
| North Platte below Keystone Dam | 1,300 |
3,246 |
2,525 |
52 |
|||
| Keystone Dam Diversion | 1,709 |
1,702 | 1,730 |
1,452 |
|||
| North Platte at North Platte |
|
3,394 |
2,724 | 363 |
|||
| South Platte at Roscoe | 3,050 |
3,400 | 3,860 | 14,200 | |||
| South Platte at North Platte | 2,285 |
3,781 | 4,614 | 6,160 | |||
| Diversion to CNPPID Supply Canal | 2,278 |
2,226 | 2,267 | 2,287 | |||
| Platte River at Overton | 5,407 |
6,959 | 7,292 |
14,915 |
|||
| Platte River at Kearney | 6,980 |
6,410 | 6,810 | 15,998 | |||
| Platte River at Grand Island | 7,670 |
6,200 | 6,360 | 13,015 |
|||
| * Percent of capacity is dependent upon maximum elevations/operating levels at different times of the year. Lower maximum levels were established in 1974 after a 1972 storm caused damage to the dam's face. The limits are in effect for periods when high winds and waves are most likely to occur. (See Lake McConaughy Maximum Operating Levels table) ** Flow too low for gauge to measure @ - Yesterday's average flow # - Ice affecting stream gauges; readings may not be accurate N/A - Data temporarily unavailable (data not reported from gauge) | |||||||
| Note: Flow records during winter months are often affected by ice conditions in the river(s). When ice forms, the river cross-section is constricted, resulting in a higher river stage for the amount of flow than exists during ice-free conditions. Therefore, the streamflow readings may be too high and freezing temperatures may also affect the gauging equipment, resulting in inaccurate data recording or no report from the gauge. Flows may be estimated under these circumstances. Equipment or communications problems also sometimes prevent transfer of river stage data during other times of the year, resulting in an N/A display in the table above. | |||||||
 |
|||||||
|
|||||||